Acquisition of financial assets and external financing in Germany in the fourth quarter of 2024 Results of the financial accounts by sector
- Households rebalance their deposits in favour of short-term deposits
- Real return varies significantly along the wealth distribution
- External financing of non-financial corporations falls to €23 billion
Households’ financial assets continue their series of growth
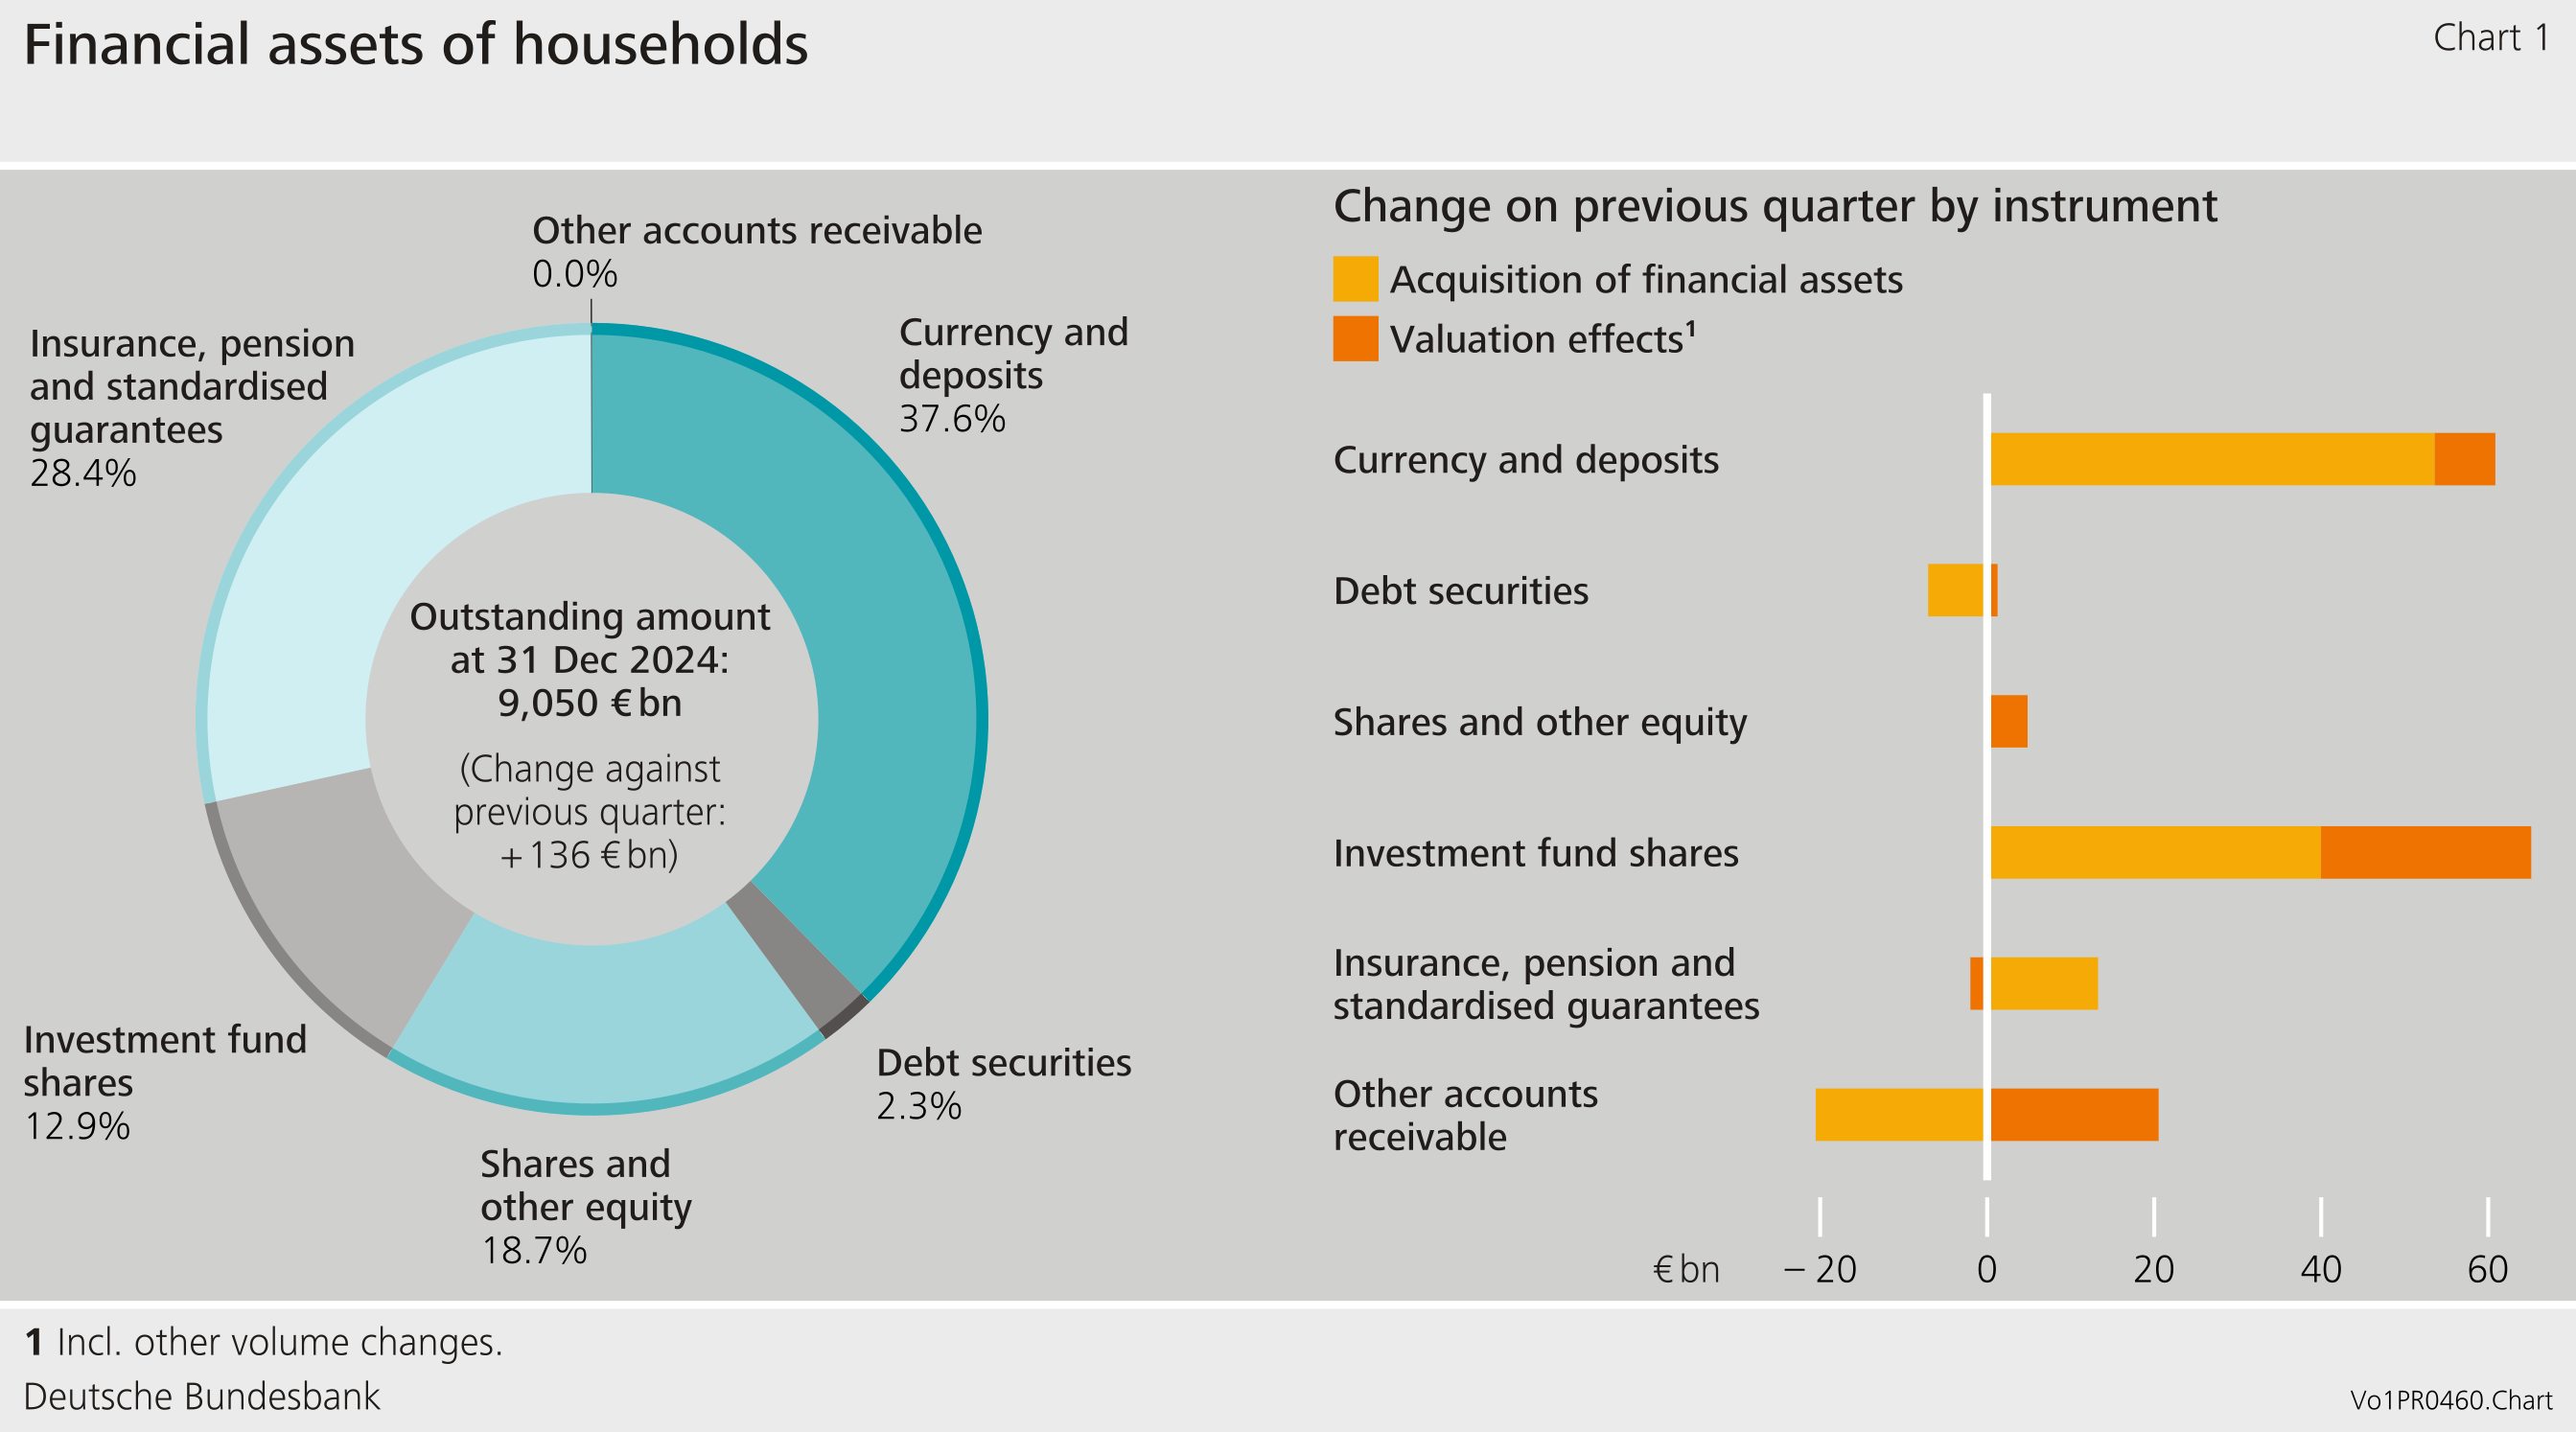
In the fourth quarter of 2024, German households’ nominal financial assets grew by €136 billion, totalling €9,050 billion as at the end of the year. This is now the fifth increase in succession, continuing the growth streak that has been ongoing since the end of 2023. Households increased their claims by €79 billion and generated valuation gains of €57 billion.
In the fourth quarter of 2024, households shifted their funds from longer-term, higher-interest deposits to highly liquid short-term deposits. Savings deposits and savings certificates were reduced by €16 billion. At the same time, households acquired cash and transferable deposits amounting to €65 billion, with transferable deposits accounting for €55 billion of this figure. A similarly high acquisition of cash and transferable deposits was last recorded in mid-2021. This greater preference for highly liquid short-term deposits is likely attributable to heightened economic uncertainty and falling interest rates. In line with this, the spreads between the yields on different types of deposit in Germany have narrowed as monetary policy rates have been lowered.
Debt securities were sold in the amount of €7 billion. While purchases of shares and other equity were close to zero on balance, listed shares from domestic issuers were sold in the amount of €3 billion.
Investment fund shares saw a strong build-up of claims totalling €40 billion. However, a considerable portion of this (€21 billion) was attributable to the purchase of money market fund shares. Money market fund shares are often regarded as close substitutes for deposits.[1]
Valuation gains were mainly recorded for foreign shares (€15 billion) and investment fund shares (€25 billion).
Real return on financial assets varies along the net wealth distribution
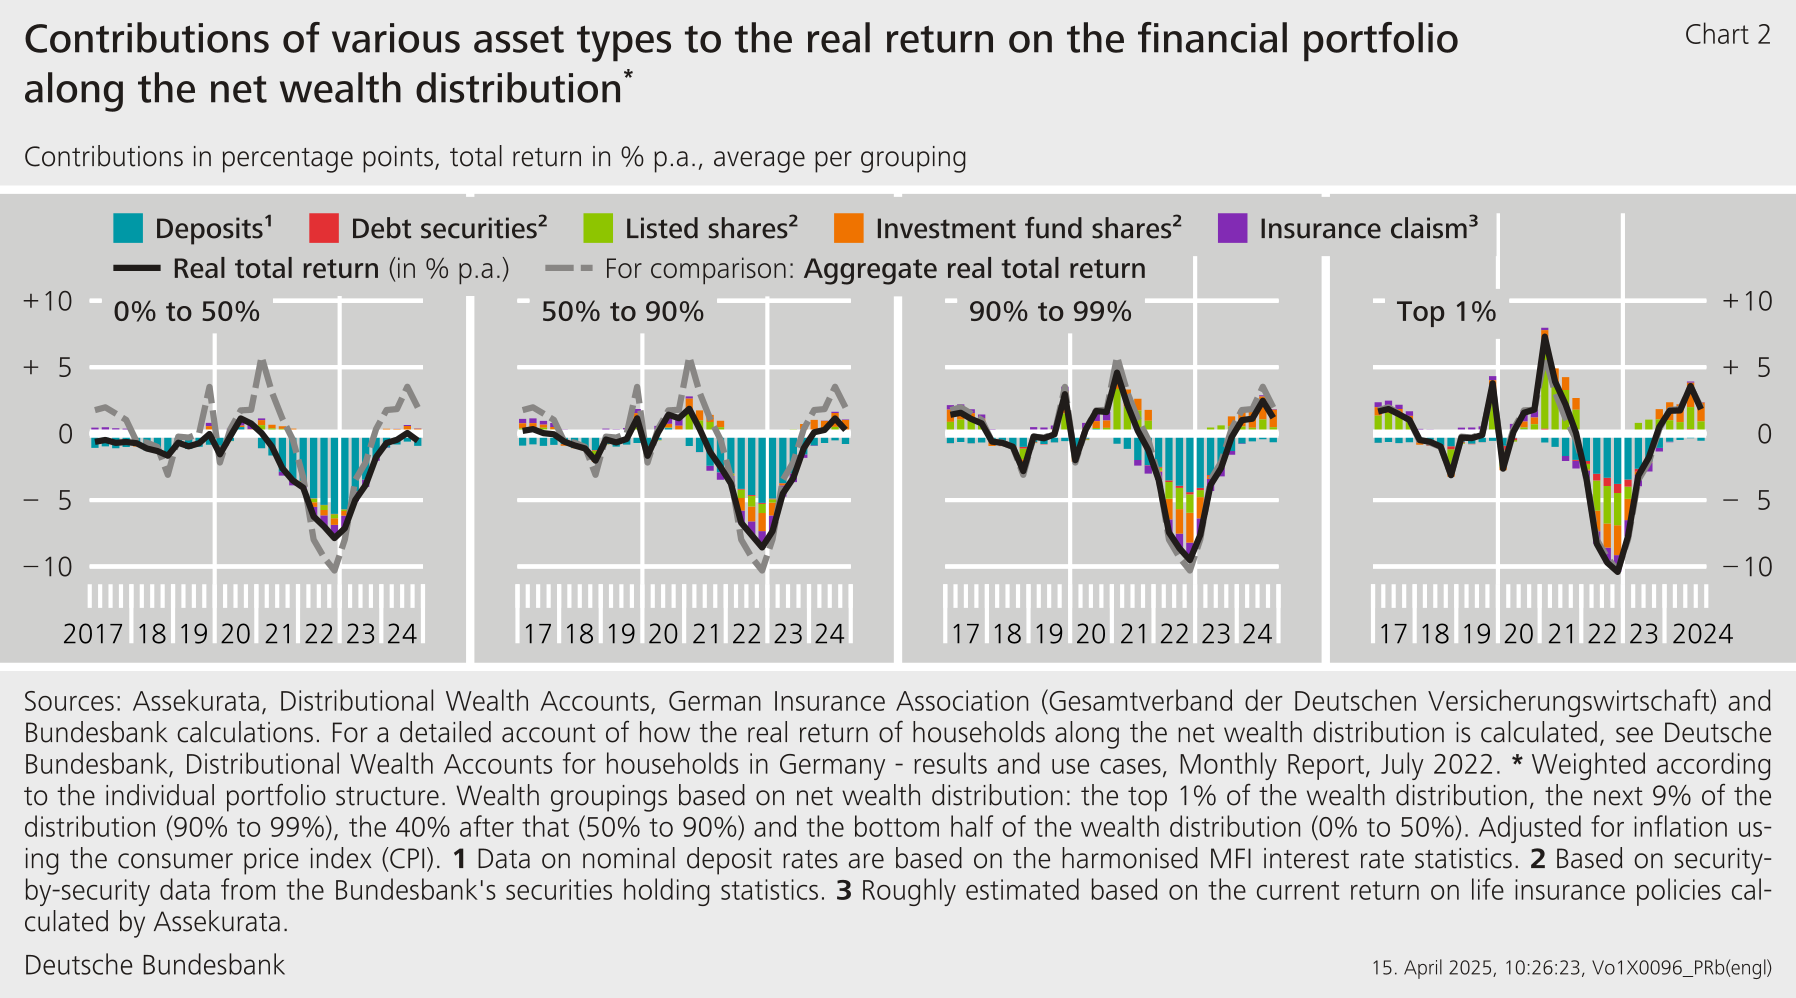
The real total return, i.e. the return adjusted for inflation, on financial assets represents the actual return on financial assets for households. With the Distributional Wealth Accounts (DWA), the Bundesbank provides additional data on the distribution of household wealth.[2] Considering the individual and period-specific structures of financial assets chart 2 shows the real total return on financial assets along the net wealth distribution.
Comparing four wealth groups reveals that the average possible real return rises with net wealth.[3] Differences in returns between wealth groups are due to variations in portfolio composition coupled with the differing returns on individual asset types. This is particularly evident when looking at the contributions of various investment instruments to total return. The less wealthy half of the distribution holds its financial assets almost exclusively in low-risk investments in the form of deposits and insurance claims. As the return on these two asset types has been relatively weak in recent years, the total return has also been correspondingly low and, in most cases, even negative. By contrast, the return for the wealthiest 10% of households was influenced significantly by the return on capital market instruments. In particular, positive price developments contributed to high returns over the course of 2024, which were then reflected accordingly in the total return. Looking at all households, the aggregate real total return fell to just under 2% in the fourth quarter of 2024, with only shares and investment fund shares making notable positive contributions. The still negative real return on deposits continued to have a dampening effect.
Little movement in household liabilities
Households’ liabilities grew slightly, rising by €5 billion to a total of €2,136 billion in the fourth quarter of 2024. This small increase was mainly due to a decline in borrowing to €4 billion. However, owing to the nominal increase in gross domestic product, the debt ratio fell by 0.2 percentage point to 49.6%.[4]
Overall, households’ net financial assets rose by €132 billion to €6,913 billion, continuing the positive trend from the previous quarters.
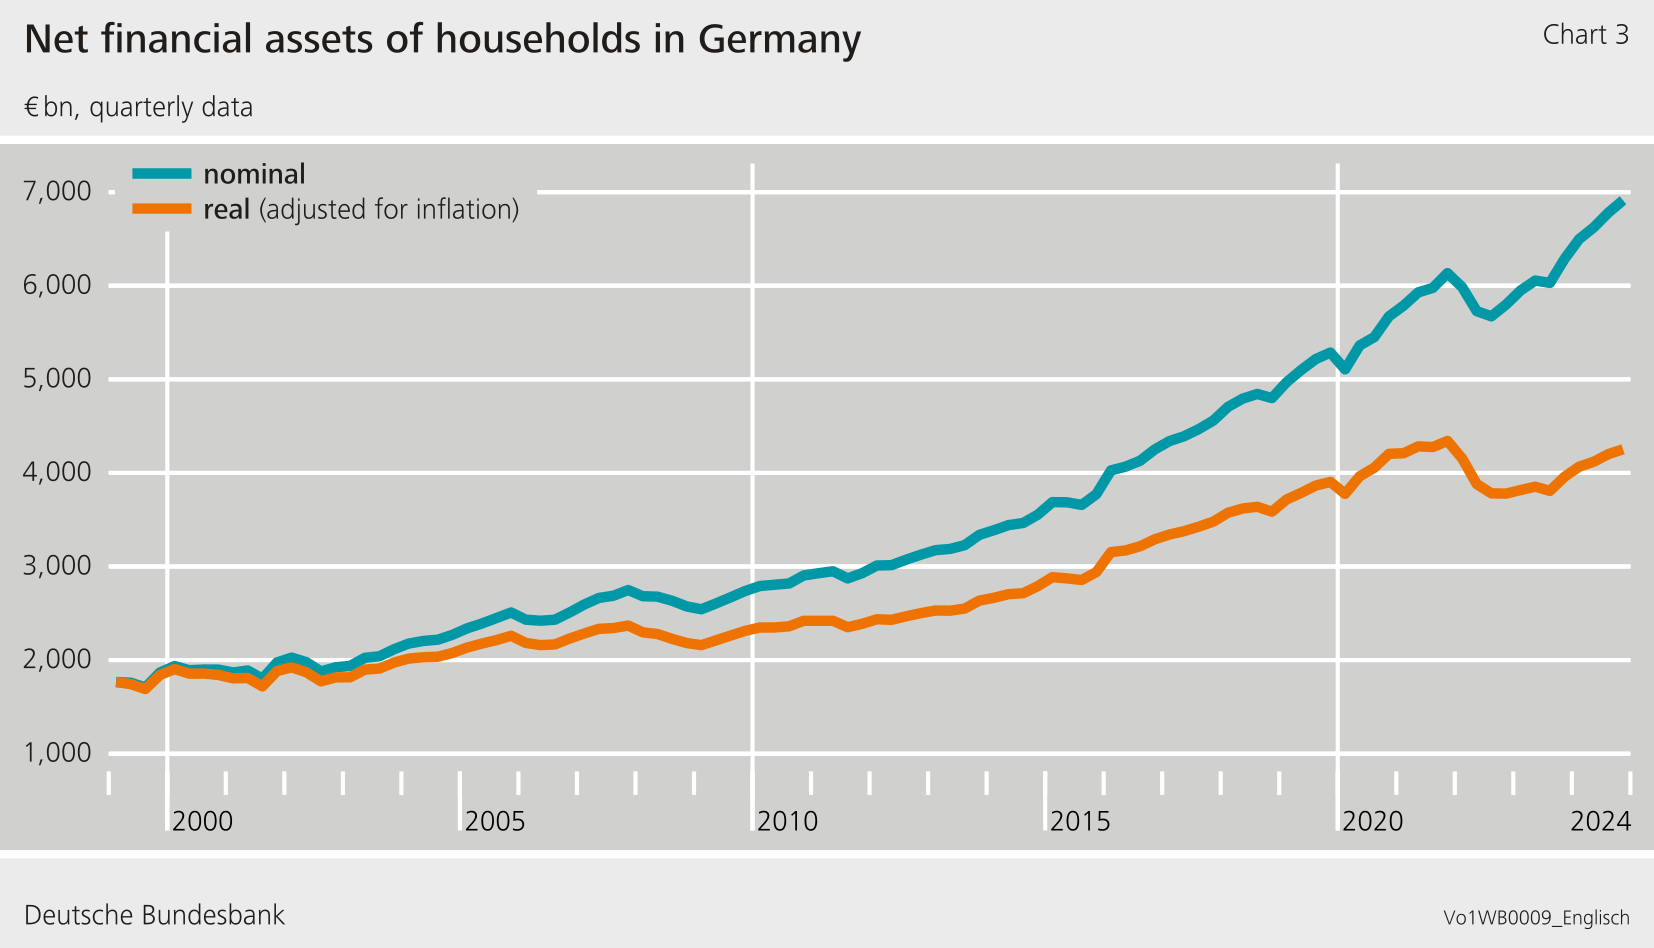
Real net financial assets remain below their peak from 2022
The purchasing power of nominal net financial assets fluctuates with the rate of inflation. For example, an inflation rate that exceeds nominal growth in net financial assets leads to an increase in net financial assets in nominal terms, but means that not as many goods and services can be purchased as before. To this extent, especially during periods of high inflation, it may make sense to also look at developments in financial assets in real terms, i.e. in 1999 prices. Here, significant differences in developments can be seen in the period from 2022, in particular. Nominal net financial assets recovered rapidly from the price slumps in the capital market during the first three quarters of 2022 and then regularly reached new all-time highs. Real net financial assets, by contrast, are continuing to move at a lower level than in 2022.
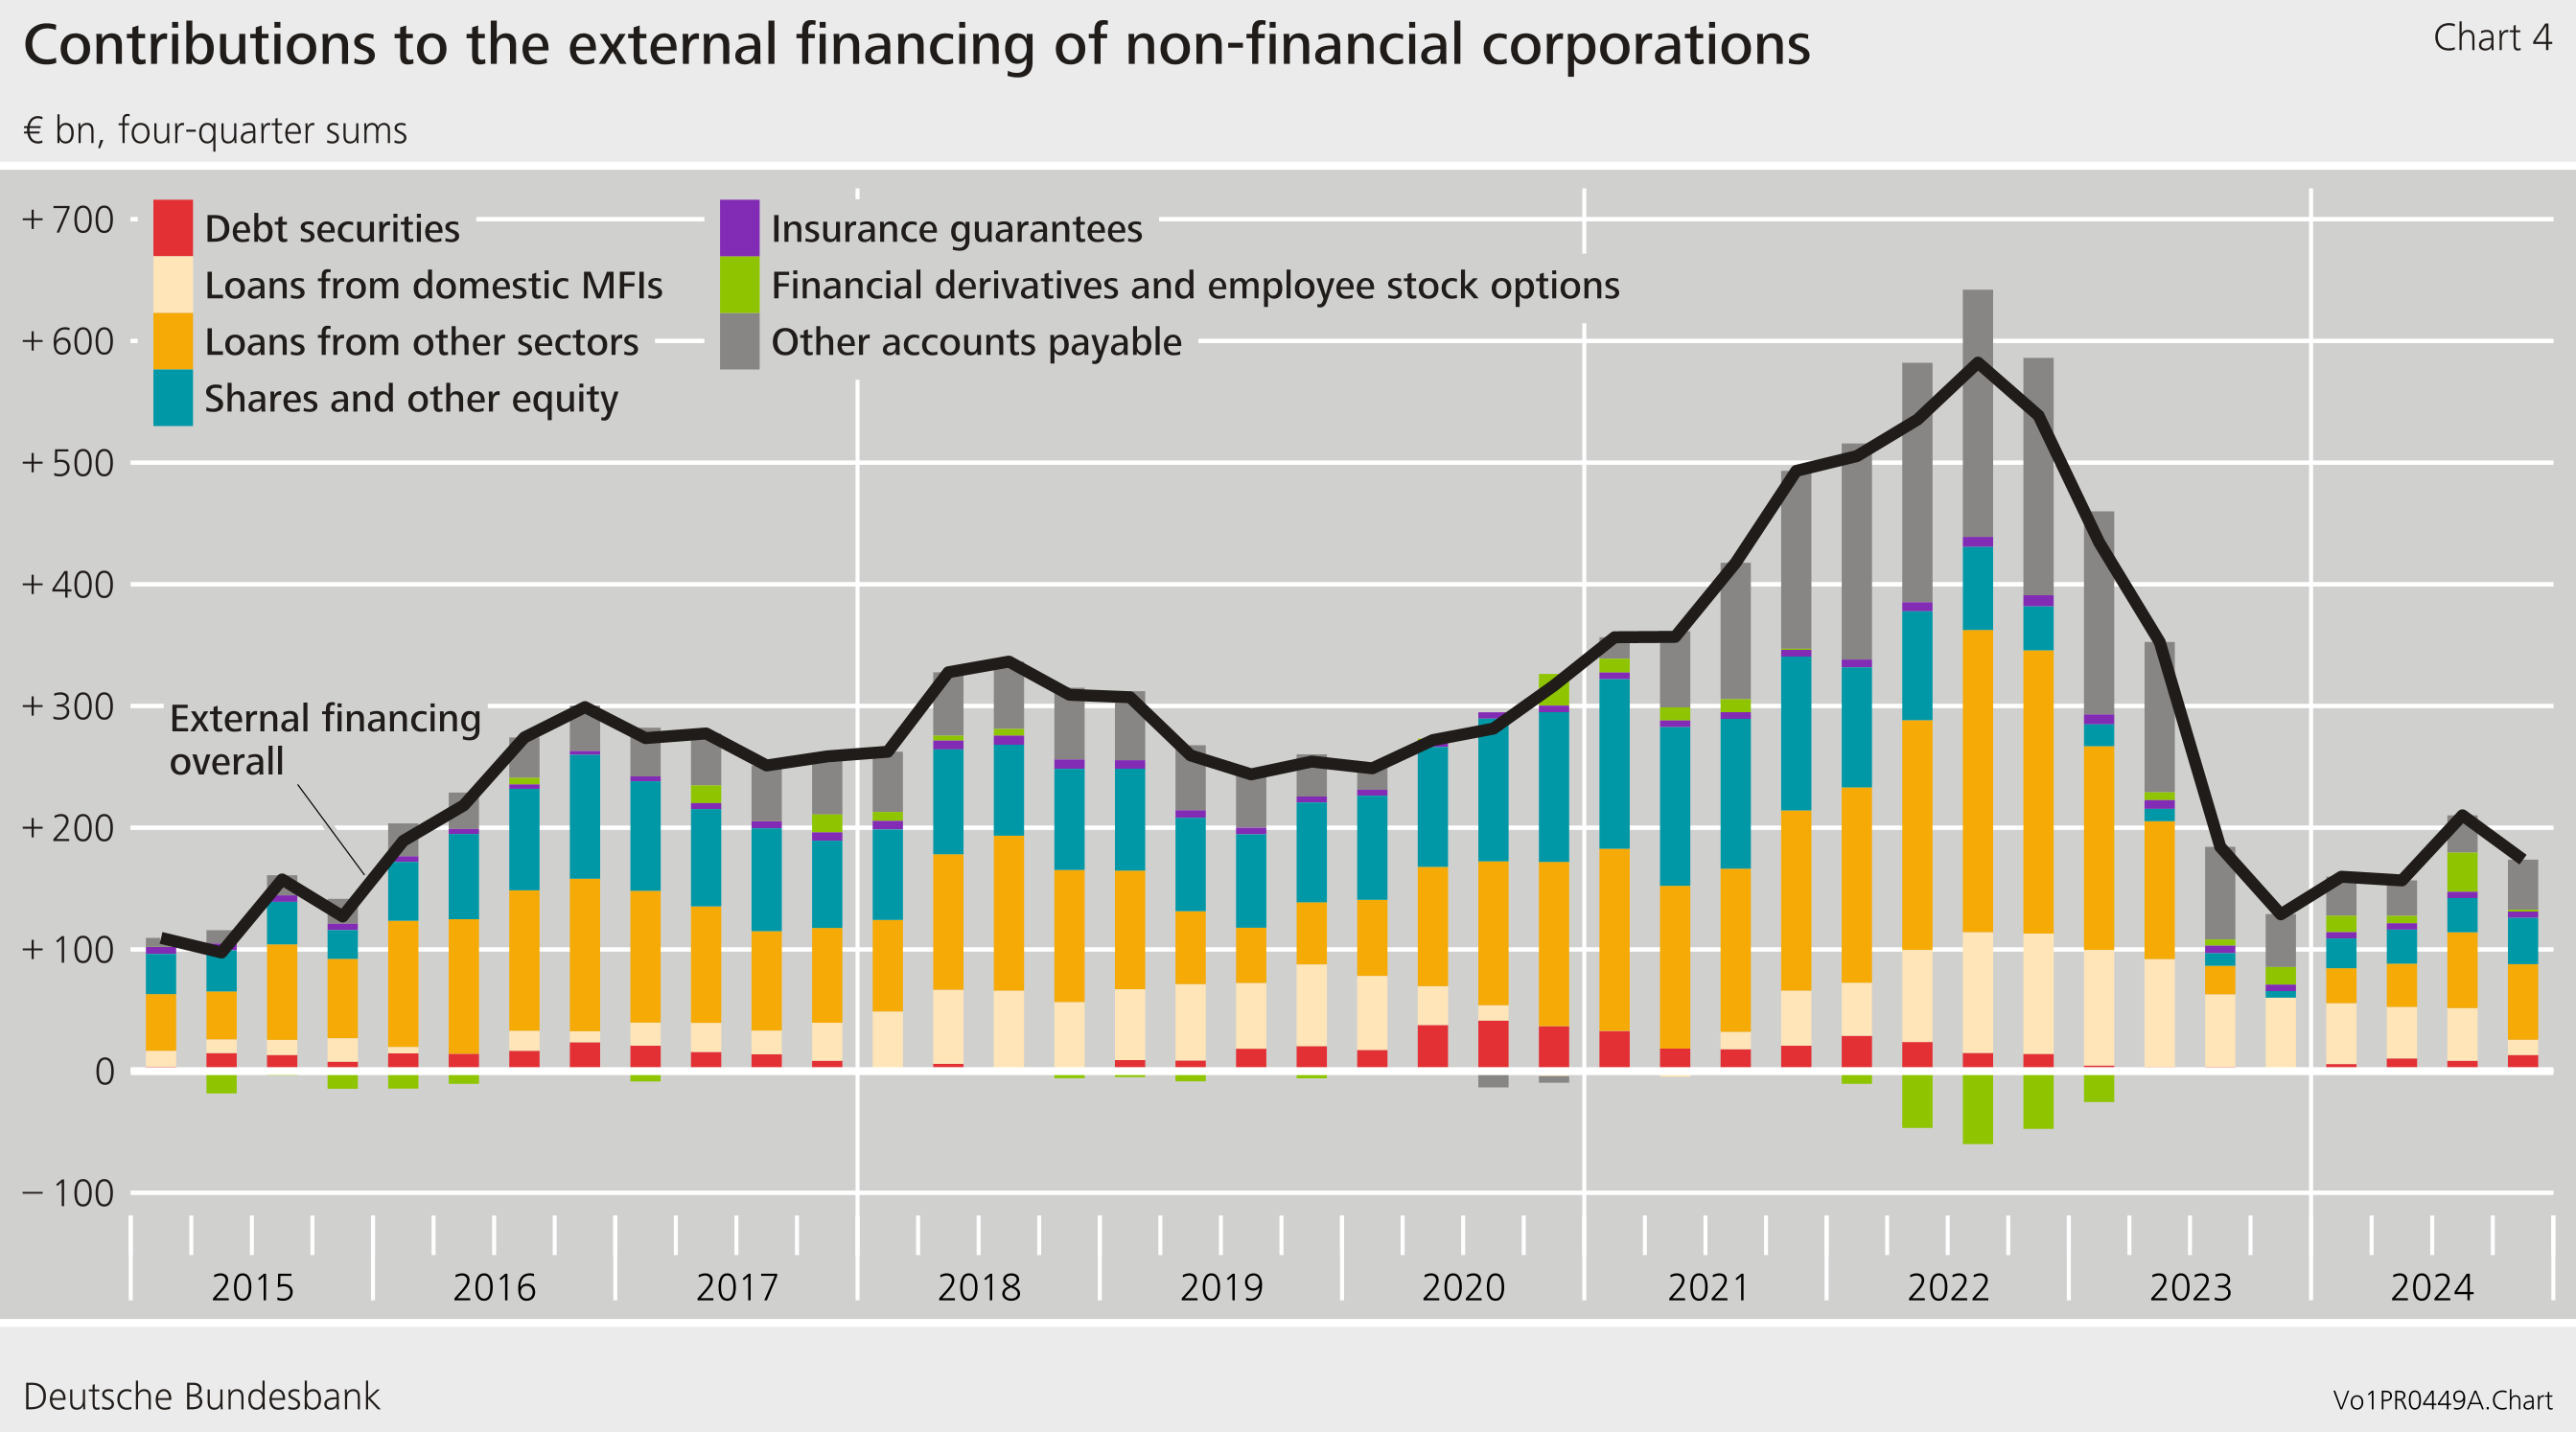
External financing of non-financial corporations down significantly
Non-financial corporations’ external financing fell by €36 billion to €22 billion in the fourth quarter. The key driver of this was other liabilities, which amounted to €21 billion. These are mainly trade credits.
Loan-based external financing fell considerably, from €30 billion in the previous quarter to – €1 billion. On balance, borrowing from domestic banks (– €6 billion) and borrowing from abroad (– €12 billion) were both significantly negative. Issuance of debt securities was close to zero. Here, as in the previous quarter, slightly more debt securities were redeemed than were issued.
Issuance of shares and other equity remained comparatively stable at €7 billion, following €9 billion in the preceding quarter.
Looking at the year as a whole, i.e. based on four-quarter moving sums, external financing continued to show little momentum. It declined slightly compared with the previous quarter and remained at a similar level to that seen since mid-2023.
Non-financial corporations’ liabilities were moving largely sideways as at the end of the fourth quarter of 2024. These fell slightly, dipping by €23 billion to €11,593 billion. This was due to valuation losses totalling €46 billion, which were mostly related to issued equity. The sideways movement in debt instruments, combined with the nominal increase in economic output, led to a significant decline in the debt ratio from 67.9% to 67.3%.[5]
The financial assets of non-financial corporations fell by €30 billion, declining to €8,835 billion as at the end of the quarter under review. Taken together, non-financial corporations’ net financial assets moved sideways to – €2,757 billion.
Owing to interim data revisions of the financial accounts and national accounts, the figures contained in this press release are not directly comparable with those shown in earlier press releases.
- ESA 2010: Money market fund shares or units are issued by money market funds which are investment funds that invest only or primarily in short-term debt securities such as treasury bills, certificates of deposit, and commercial paper and also in long-term debt securities with a residual short-term maturity.
- In the DWA, net financial assets comprise the following types of assets and liabilities: deposits, debt securities, listed shares, investment fund shares, insurance claims (life insurance and private retirement provision), financial business wealth, and liabilities in the form of loans for house purchase and other debt. Net wealth is ultimately calculated as the difference between the total aforementioned assets and liabilities. For more information on the DWA, see also https://www.bundesbank.de/en/press/press-releases/bundesbank-releases-distributional-wealth-accounts-for-households-in-germany-921302
- Specifically, the net wealth distribution is divided into four wealth groups: the top 1% of the distribution, the next 9% of the distribution (90% to 99%), the following 40% of the distribution (50% to 90%), and the less wealthy half of the distribution (0% to 50%).
- The debt ratio represents debt as a percentage of nominal gross domestic product (four-quarter moving sum).
- The partially consolidated debt ratio is calculated as the sum of loans, debt securities and pension provisions as a percentage of nominal gross domestic product (four-quarter moving sum). Intra-sector claims/liabilities are deducted from loans to derive a partial consolidation.