
ECB expands options for visualising statistical data
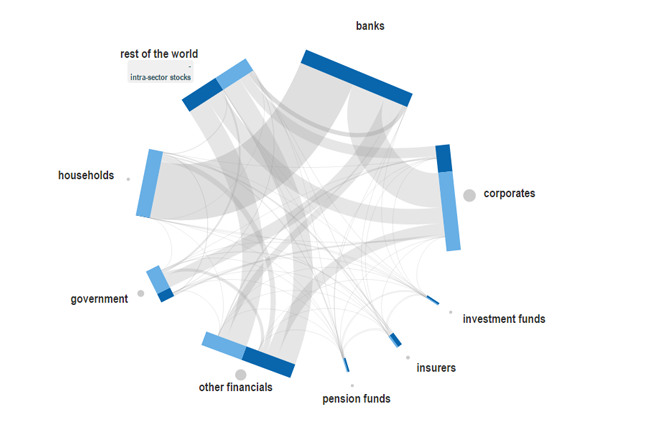
The European Central Bank (ECB) has expanded its "Our statistics" website to include new options for visually presenting statistical data. A new visualisation tool now presents statistics in the form of network graphs, accompanied by explanatory texts. This enables users to see the financial interconnectedness of euro-area institutions, both among themselves and with the rest of the world, at a single glance. Users can select individual financial instruments, sectors and countries, as well as their preferred language and time periods to gain a better understanding of who finances whom and who invests where within the broader economy.
A further key function of the website is the option to send statistics by e-mail, share such data via social media and imbed charts in other websites.