
What Moves Markets? Research Brief | 51st edition – August 2022
Are asset prices driven by news or by factors unrelated to economic fundamentals, such as market sentiment? In most asset pricing models news play a dominant role, but most empirical applications find only a low explanatory power of news. A new study examines this problem using an extensive time-stamped event database and finds that about half of all high-frequency market movements can be attributed to news.
A core idea of modern capital market models is that financial market prices should reflect all publicly available information (efficient market hypothesis). New information, especially about economic developments, should therefore be the main reason for price changes. Empirical studies, however, often attribute only a very small share of the observed market movements to such news. This is surprising, as it would imply that financial market prices are largely decoupled from fundamentals. However, one possible reason for this empirical result is that the studies overlook potentially important news. For example, the literature is usually limited to regular macroeconomic data releases, for instance regarding the gross domestic product or consumer price indices. However, these data releases cover only a fraction of the news that is relevant for financial market prices.
Combination of high-frequency financial market prices and extensive event database
In a recent discussion paper (Kerssenfischer and Schmeling, 2022), we investigate the explanatory power of news for financial market prices by constructing an extensive, time-stamped event database that includes scheduled macroeconomic data releases, central bank announcements and bond auctions as well as unanticipated news such as election results, rating downgrades, wars and natural disasters. We combine this event database with high-frequency changes in equity prices and bond yields, for both the United States and the euro area, going back to 2002.
To gauge the explanatory power of news, we calculate the share of market movements that occurs in narrow windows around clearly identifiable news. Figure 1 illustrates our approach with a concrete example. The chart shows the yield development of German government bonds with a ten-year maturity on 7 October 2011, together with the news published on that day from our event database. The most abrupt market movement on that day occurred at 2:30 p.m. German time, when the US labour market report was released. The yield on ten-year Bunds rose by over five basis points within a few minutes. A second abrupt market movement occurred around 6:00 p.m. when the rating agency Fitch announced in two press releases in quick succession that it was downgrading Italy and Spain. German bond yields then fell significantly, about as much as they had risen since the start of trading.

The two largest yield movements on this day therefore took place in direct reaction to observable news and in this sense can be explained by news. Overall, the share of market movements explained by news amounts to more than 80 on this day. This estimate is, of course, based on the strong assumption that the entire yield changes are indeed causally linked to the selected news.
To justify this assumption, a central element of our approach is to single out the “important” news from the multitude of available news. For this purpose, we estimate a simple dummy regression: only news whose publication systematically leads to market reactions, i.e. which increase the variance of the respective financial market price, are deemed “important”, and only market movements around these important news are classified as “explained”.
This filtering step is crucial because news is published almost continuously: at least one news item in every fifth of our high-frequency time windows. Important news, on the other hand, only occurs in about 8 percent of windows. In Figure 1, this is illustrated by the coloured bars. Blue bars show explained yield changes, i.e. those that occurred in immediate reaction to important news. Red bars, on the other hand, show the unexplained yield changes, during which no or only unimportant news was published.
Figure 1 illustrates two further important details of our approach. First, we use market data at a 15-minute frequency and cover up to 14 hours of daily trading time with this data. Second, we use comparatively narrow “event windows” of 45 minutes, i.e. we usually only attribute the market movement from 15 minutes before the release to 30 minutes afterwards to a news item.
Up to half of all market movements occur in narrow time windows around news
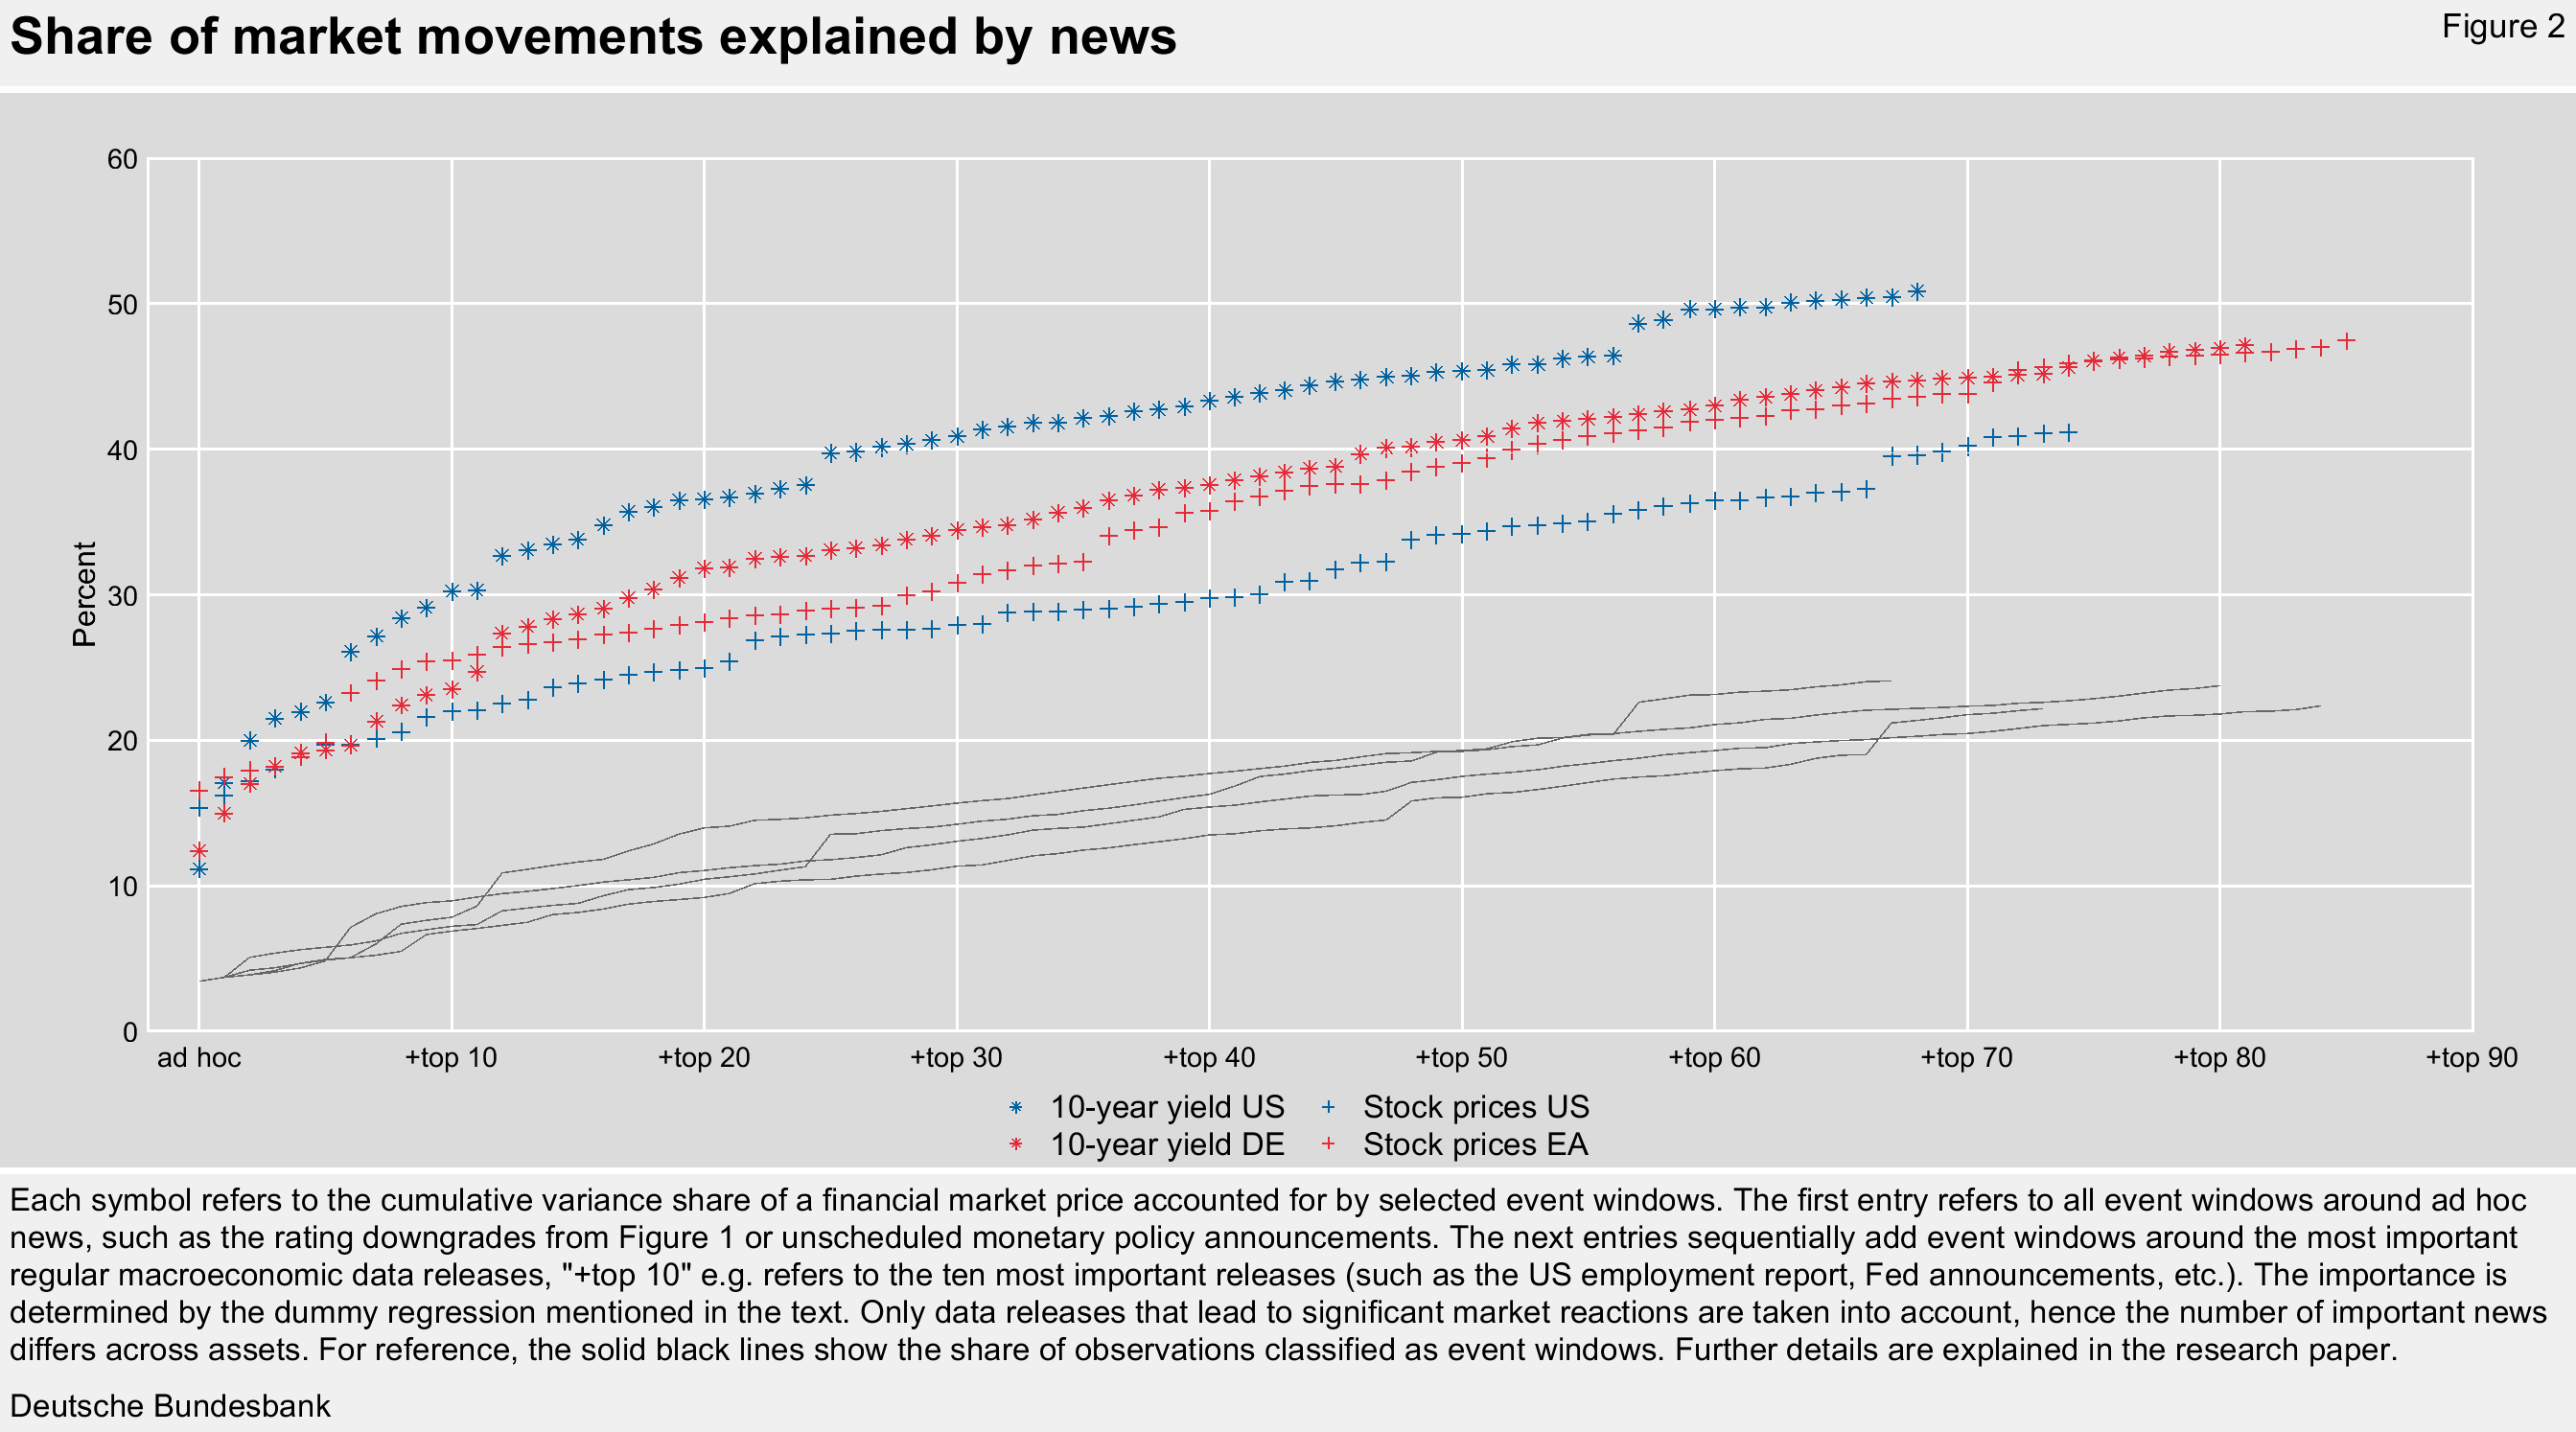
Figure 2 shows that the high explanatory power of news on the sample day selected in Figure 1 is not an exception, but rather the rule. Unscheduled “ad hoc” events – like the rating downgrades in Figure 1 – already account for about 11 to 16 percent of all market movements. Adding in the 20 most important regular data releases, this share increases to about 25 to 38 percent. Adding in all remaining important regular data releases, 41 to 53 percent of all market movements occur in event windows. Coming back to the example of ten-year German bond yields, about 81 regular news items are classified as important. Together with ad hoc events, these news items explain about 47 percent of the total observed variance of this financial market price.
Event database will be published
One of the main contributions of our paper is the time-stamped event database, which we construct from a variety of sources. The database includes not only macroeconomic data releases (over 70,000 events), but many other news items, such as announcements and results of bond auctions (over 10,000 events), central bank announcements (over 7,000 events), and a large number of ad hoc events (over 1,000 events). Particularly the ad hoc events are often neglected in the literature that studies the explanatory power of news because they are not available in a ready-to-use format. Our new database – which will be made publicly available – aims to close this gap.
Conclusion
About half of all stock and bond yield movements in the US and the euro area occur in narrow time windows around clearly identifiable news and, in this sense, can be explained by news. Compared to many previous studies, the share of explained market movements is quite high. Thus, financial market prices do not seem to be decoupled from news about fundamentals.
However, our study leaves open the question of how news leads to price movements. News could directly change the fundamental value of financial market prices, for example by changing expectations about future cash flows, or by changing the so-called discount factor used to convert these payments into a present value. However, it is also possible that news has a rather indirect influence on prices, for instance by leading to – possibly irrational – transactions and capital flows between market participants, which then result in price movements.
In any case, our results and database should be useful for future reearch to test theories about the fundamental drivers of market movements.
| Disclaimer |
| The views expressed here do not necessarily reflect the opinion of the Deutsche Bundesbank or the Eurosystem. |
Reference
- Kerssenfischer, M. und Schmeling, M. (2022), What Moves Markets?, Deutsche Bundesbank Discussion Paper, Nr. 16/2022
| Author |

© PicturePeople
Economist at Deutsche Bundesbank, Directorate General Economics |
News from the Research Centre
Publications
- “Time-varying return correlation, news shocks, and business cycles“ by Norbert Metiu (Deutsche Bundesbank) and Esteban Prieto Fernandez (Deutsche Bundesbank) will be published in the European Economic Review.
- “The Hockey Stick Phillips Curve and the Effective Lower Bound” by Philipp Lieberknecht (Deutsche Bundesbank) and Gregor Boehl (Universität Bonn) will be published in the Journal of Economic Dynamics and Control.
Events
- Spring Conference on Expectations of Households and Firms
24. – 25.04.2025 | Eltville am Rhein
293 KB, PDF